Automatically roadmapping from Excel Data
Searching for a tool to automate the creation technology roadmaps at work, I quickly
realized that there was really nothing out there that was flexible enough , or
that could produce something of presentation quality that didnt need tweaking.
This article is about how to implement one in Excel, and will provide a fully functional downloadable roadmap generator.
Roadmap format
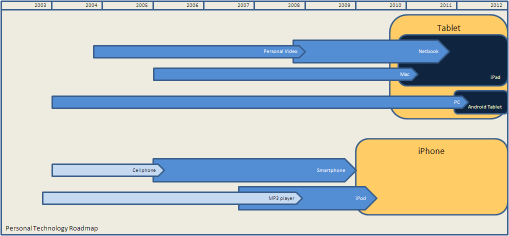
For our example, we will use data that represents a Personal Technology roadmap,
The roadmap will look like this, and will be constructed from grouped excel shapes
that can be pasted into Powerpoint, Word or any other document that takes Excel
Shapes. To resultant group of shapes can be pasted into a powerpoint as is, or
as an bitmap as required.
Data Format
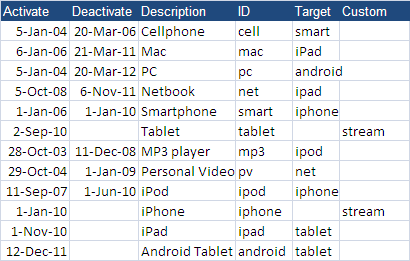
One of the design objectives was to keep the data format as simple as possible. Here
is the data that created the roadmap. The first 4 columns are self explanatory,
the 'target' column is the ID of the roadmap outcome (for example both smart
and ipod -> iphone), and the custom column is used to identify a particular
format to apply to that item, as opposed to the default.
Parameters
The final thing needed before we dive into the code is a parameter sheet to define
the colors, size, shapes, behaviors associated with the roadmap. The idea is
that a parameter sheet represents a style that is used for a family of roadmaps
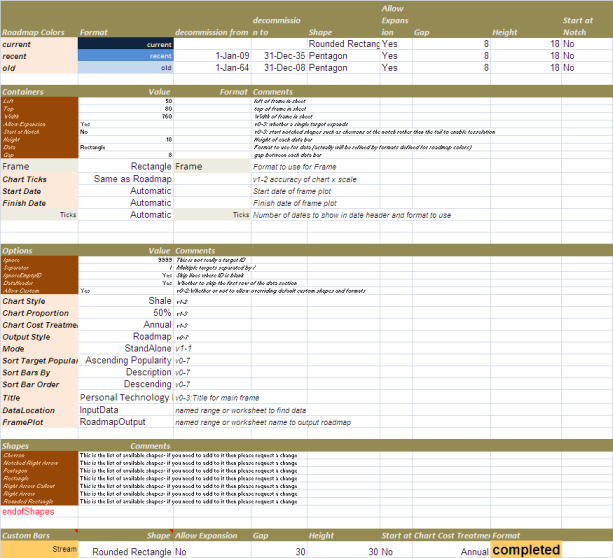
so they all have the same look and feel. The parameter sheet looks like this.
For the purposes of this article we will only briefly touch on the parameters
needed to demonstrate the techniques, since this is not a tutorial on the provided
example application. The concept here is that the parameters are divided into
'blocks', separated by a blank row - for example 'Containers' and 'Roadmap Colors'
are both parameter blocks. The Row and Column headings are used to identify the
position of a parameter value - so roadmap colors.recent.shape = 'Pentagon' in
the example below. This is a straightforward technique I use in many projects,
and the classes required to make this simple are provided in the downloadable
code. Specifically, the 'Pentagon' example mentioned would be addressed as dSets("Roadmap Colors").Cell("recent","Shape").Value using the provided cDataSets family of classes, thus abstracting the parameter from
its physical spreadsheet location. Occassionally the format of a cell (rather
than a value), is used as a parameter, for example, roadmap items that have the
Custom Format 'stream' specified in the custom column of their data would inherit
their shape's format (fill,color,font,text alignment) from the cell referenced
by the range dSets("Custom Bars").Cell("stream","Format").Where
Getting Started
The main code is rather straightforward, and makes use of a set of classes that abstract
the data from its physical location on the sheet. Although these are not the
topic of this article you can read more about them here. Once dSets.Create is executed, the physical location of both the parameters and the sheet data are
no longer referenced. The main work is done in the custom class cRoadMapShape, which will be the main topic of this article. One thing you will see here is that
recursion is used extensively. When you look at the layout of the roadmap and
data, you can see that many items have a 'target'. This target is the ID of the
item into which it converges. For the purposes of plotting a roadmap, the depth
of this parent (target)/child relationship is unknown and variable. This is why
recursion must be used. In the wrapper application below, scroot refers to the
outer frame of the roadmap, which is the utilimate parent of all roadmap items.
Option Explicit
Public Sub RoadMapper()
Dim dSets As cDataSets
Dim rData As Range, rParam As Range, rplot As Range
' where the parameters are
Set rParam = Range("Parameters!$a:$g")
' automatically find where the data is
Set rData = getLikelyColumnRange
' plot on the same page as the data
Set rplot = rData.Resize(1, 1)
' get the data and the parameters
Set dSets = New cDataSets
With dSets
.create
.init rData, , "data"
.init rParam, , , True, "roadmap colors"
.init rParam, , , True, "containers"
.init rParam, , , True, "options"
.init rParam, , , True, "custom bars"
End With
With dSets.DataSet("data")
If .Where Is Nothing Then
MsgBox ("No data to process")
Else
' check we have fields we need
If .HeadingRow.Validate(True, "Activate", "Deactivate", "ID", "Target", "Description") Then
Call doTheMap(dSets, rplot)
End If
End If
End With
End Sub
'---------------------------------------------------------
Private Sub doTheMap(ByRef dSets As cDataSets, rplot As Range)
Dim scRoot As cShapeContainer, sc As cShapeContainer, dr As cDataRow
' this will be the root - the frame
Set scRoot = New cShapeContainer
scRoot.create scRoot, , rplot, dSets
With dSets.DataSet("data")
' create for each datarow
For Each dr In .Rows
Set sc = scRoot.Find(dr.toString("ID"))
If sc Is Nothing Then
Set sc = New cShapeContainer
sc.create scRoot, dr
scRoot.Children.Add sc, sc.ID
Else
MsgBox sc.ID & " is a duplicate - skipping"
End If
Next dr
End With
' sort out the parent/child relationships and delete all the existing shapes on this
sheet
scRoot.SpringClean
' make the scale & sort
scRoot.createScale
scRoot.sortChildren
' plot the shapes and group them
scRoot.makeShape
scRoot.groupContainers
End Sub
Recursion and the cShapeContainer class
Every roadmap shape, including the outer frame, is an instantiation of the cShapeContainer class. The full code of this class is in the downloable example, but here are some
key methods that illustrate the necessary use of recursion. For example, deciding
the height of a particular shape not only depends on its own height and gap between
shapes, but it is also affected by each of its childrens' (and its childrens'
children etc. etc.) height, since it needs to be big enough to show each child
landing on it. This is accomplished through a series of methods as follows. The
mySpace property below, will return the total height a particular cShapeContainer needs to be to accomodate its own height, plus the height of all its children and
their descendents as well as any gaps or other formatting requirements inherited
from the parameter sheet. Each element of space is implemented as property as
below. Note the recursive nature of some of these properties as they work through
the same properties for each of their children and further descendents.
' this is the gap after me
Public Property Get MyGapAfterMe() As Single
MyGapAfterMe = paramGap
End Property
' the gap to leave before i plot my children if i have any
Public Property Get MyGapBeforeChildren() As Single
If pChildren.Count > 0 Then
MyGapBeforeChildren = paramGap
Else
MyGapBeforeChildren = 0
End If
End Property
' how much to allow myself to expand
Public Property Get MyExpansion() As Boolean
MyExpansion = paramExpansion
If Not paramExpansion Then
MyExpansion = biggestBranch() > 1
End If
End Property
Public Property Get MySpace() As Single
Dim sc As cShapeContainer
Dim ht As Single
If pChildren.Count = 0 Then
ht = paramHeight + MyGapAfterMe
Else
If MyExpansion Then
ht = ht + MyGapBeforeChildren
For Each sc In pChildren
ht = ht + sc.MySpace
Next sc
ht = ht + MyGapAfterMe()
Else
ht = paramHeight + MyGapAfterMe()
End If
End If
MySpace = ht
End Property
Public Property Get MyShapeHeight() As Single
MyShapeHeight = MySpace - MyGapAfterMe
End Property
' calculate the longest branch from here.
Public Function biggestBranch() As Long
Dim sc As cShapeContainer
Dim ht As Long, t As Long
ht = pChildren.Count
For Each sc In pChildren
t = sc.biggestBranch()
If t > ht Then
ht = t
End If
Next sc
biggestBranch = ht
End Function
Creating the shapes
Creating the shapes is the most complex activity, since we have to not only figure
out their height, as discussed in the MySpace property but also deal with the width (calculated as a proportion of the total roadmap
scale), their left position (as a proprtion of time passed from the beginning
of the roadmap to the item's activation date), and of course apply all the formats
(some are date based as per the default formatting in the 'roadmap colors' parameter
block) or they might be inherited from a custom format. In addition the type
of shape (pentagon, rectange etc) is variable. Some shapes also have a 'notch'
at the beginning (for example a chevron). In this case, the length of the shape
might need to be modified so that one chevron fits neatly into another. The additional
width needed to achieve this is a function of the height of the item (basic trig),
and so on it goes. Here is the function that adds the shape and makes the necessary
adjustments through the myWidth and myLeft properties. It is of course also recursive since the z-Order between parents and
children needs to be carefully preserved.
' this is the most complex part - creating the shapes of the correct size and placing
them in the right spot
Public Sub makeShape(Optional xTop As Single = -1)
Dim sc As cShapeContainer, s As Shape, xNextTop As Single
' this would be the default call - place the frame at the place defined in the parameters
If xTop = -1 Then
xTop = paramFrameTop
End If
' make a shape
Set pShape = Plot.Worksheet.Shapes.AddShape(paramShapeType, paramFrameLeft, xTop, paramFrameWidth,
MyShapeHeight)
' apply the format asked for in the parameters and add a label
shapeTemplate pShape, paramShapeTemplate, Text
With pShape
' we are going to group the shapes later - this is so we can find them
.Name = nameStub & .Name
If pscType = sctframe Then
' width and left are the default
Else
' we have to calculate width and start point using dates relative to scale
.Width = myWidth
.Left = myLeft
End If
End With
' this is where it gets tricky
xNextTop = pShape.Top
If MyExpansion Then
' if we are allowing expansion of targets then need to make a gap to accommodate
my children
xNextTop = xNextTop + MyGapBeforeChildren
End If
For Each sc In pChildren
' make a shape for each of my children
sc.makeShape xNextTop
' figure out how much space my child needed and start the next one after it
xNextTop = xNextTop + sc.MySpace
Next sc
End Sub
'calculates my width relative to root width using start/finish dates
Private Property Get myWidth() As Single
If pRoot.Shape Is Nothing Then
myWidth = paramFrameWidth
Else
myWidth = pRoot.Shape.Width * Duration / pRoot.Duration
End If
End Property
'calculates my left start relative to root width using start/finish dates
Private Property Get myLeft() As Single
If pRoot.Shape Is Nothing Then
myLeft = paramFrameLeft
Else
myLeft = pRoot.Shape.Left + (Activate - pRoot.Activate + 1) / pRoot.Duration * pRoot.Shape.Width
End If
End Property
Summary
Roadmap generation turned out to be a pretty complex problem, maybe better achieved
in a language other than VBA. However, as usual it rose to challenge. Please
download the roadmapper example. It's called Roamapgenerator.xlsm. You will find the full code of all the
classes that have been discussed here as well as an example wrapper application.
As always, you can use the code as you wish for non-commercial use. I welcome
feedback, suggestions, and improvements. I did not have space in this article
to cover all the topics that I came across in the development of this tool, but
if there is demand I may cover some of those, including some new features such
as being able to update the source data through shape manipulation and creating
area graphs of costs assigned to roadmap items over time in a future article.