To capture a SQL Server trace using SQL Server Profiler, you need to create a trace. Go to Tools and SQL Server Profiler from Microsoft SQL Server Management Studio. Create new trace
Select the events you want to collect
The events I suggest you collect include:
· Deadlock graph
· Lock: Deadlock
· Lock: Deadlock Chain
· RPC:Completed
· SP:StmtCompleted
· SQL:BatchCompleted
· SQL:BatchStarting
You don’t need to select many data columns to capture the data you need to analyze deadlocks, but you can pick any that you find useful.
· Events
· TextData
· ApplicationName
· DatabaseName
· ServerName
· SPID
· LoginName
· BinaryData
Once you have created the trace using the above steps, run it. If you are using the SQL Server Profiler GUI, trace results are displayed in the GUI as they are captured. In addition, you can save the events you collect for later analysis.
When we click Deadlock Graph event in Profiler, a deadlock graph appears at the bottom of the Profiler screen, as shown below.
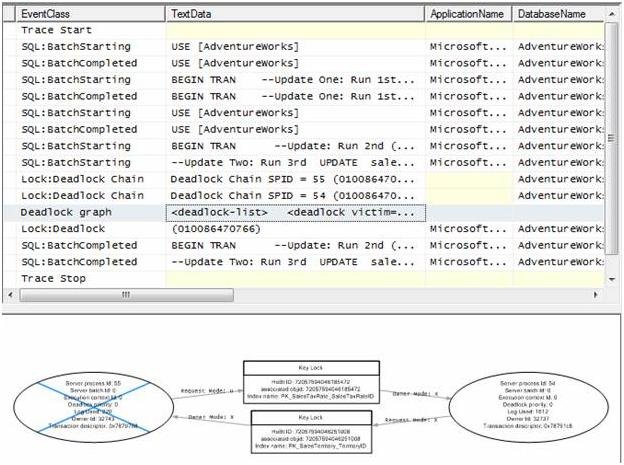
The left oval on the graph, with the blue cross, represents the transaction that was chosen as the deadlock victim by SQL Server. If you move the mouse pointer over the oval, a tooltip appears. This oval is also known as a Process Node as it represents a process that performs a specific task, such as an INSERT, UPDATE, or DELETE.
The right oval on the graph represents the transaction that was successful. If you move the mouse pointer over the oval also, a tooltip appears. This oval is also known as a Process Node.
The two rectangular boxes in the middle are called Resource Nodes, and they represent a database object, such as a table, row, or an index. These represent the two resources that the two processes were fighting over. In this case, both of these Resource Nodes represent indexes that each process was trying to get an exclusive lock on.
The arrows you see pointing from and to the ovals and rectangles are called Edges. An Edge represents a relationship between processes and resources. In this case, they represent types of locks each process has on each Resource Node.
For more information on this check the following link.
http://www.simple-talk.com/sql/learn-sql-server/how-to-track-down-deadlocks-using-sql-server-2005-profiler/