The Microsoft Office Chart object can be used to achieve your goal.
The Microsoft Office Chart object is a part of Office Web Component and copied/registered to local computer when you install Microsoft Office.
How to use it in VB.NET?
Right-click Toolbox -> Choose items... -> COM tab -> Choose "Microsoft Office Chart 11.0"
Then the control named "Microsoft Office Chart 11.0" will appear in Toolbox.
You can drag&drop it to Form.
Demo project: http://www.codeproject.com/KB/graphics/ChartOWC.aspx
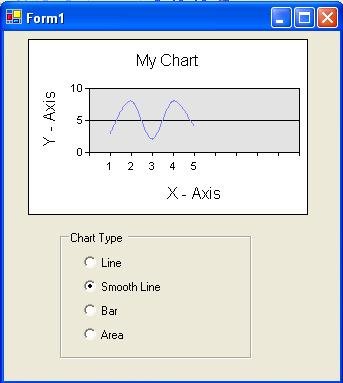
Simple Charts Using OWC (Office Web Component)
In addition, there are some third components used to render line graph/chart.
1. csXGraph ActiveX control, draw Line Graph, Bar Chart and Pie Chart
http://www.chestysoft.com/xgraph/vbnetdemo.asp
Usage and sample: http://forums.microsoft.com/MSDN/ShowPost.aspx?PostID=2432978&SiteID=1
2. Graphi - The Line Graph Component
http://www.codeproject.com/cs/miscctrl/Graphi.asp
3. Create Dynamic Line Chart graph
http://www.codeproject.com/useritems/Dynamic_Line_Chart.asp
4. Creating Line Chart For WebForms
http://www.codeproject.com/aspnet/LineGraph.asp