ASP.NET - Tracing in ASP.NET?

Asked By aman on 30-Aug-11 02:54 AM
hi all,

what is tracing?
how to achieve tracing in asp.net?
different ways of doing tracing?

thanks and regards
Aman Khan
TSN ... replied to aman on 30-Aug-11 02:56 AM
hi..

Tracing in ASP.NET 2.0

Tracing is a way to monitor the execution of your ASP.NET application. You can record exception details and program flow in a way that doesn't affect the program's output.

In ASP.NET 2.0, there is rich support for tracing. The destination for trace output can be configured with TraceListeners like the EventLogTraceListener.

ASP.NET 2.0 Improvements for Tracing

  • ASP.NET Tracing has increased precision from 6 digits to 18 digits for highly accurate profiling.

  • Trace forwarding between the ASP.NET page-specific Trace class and standard Base Class Library's (BCL) System.Diagnostics.Trace used by non-Web developers.

First, we will explore ASP. Net's tracing facilities first, and then learn how to bridge the gap and see some new features in 2.0 that make debugging even easier.

Page level Tracing

ASP.NET tracing can be enabled on a page-by-page basis by adding "Trace=true" to the Page directive in any ASP.NET page:

<%@ Page Language="C#" Trace="true" TraceMode = "SortByCategory" Inherits  = "System.Web.UI.Page" CodeFile="Default.aspx.cs" %>

Additionally, you can add the TraceMode attribute that sets SortByCategory or the default, SortByTime. You can use SortByTime to see the methods that take up the most CPU time for your application. You can enable tracing programmatically using the Trace.IsEnabled property.

Application Tracing

You can enable tracing for the entire application by adding tracing settings in web.config. In below example, pageOutput="false" and requestLimit="20" are used, so trace information is stored for 20 requests, but not displayed on the page because pageOutput attribute is set to false.

<configuration>
    <appSettings/>
    <connectionStrings/>
    <system.web>
      <compilation debug="false" />
      <authentication mode="Windows" />
    <trace enabled ="true" pageOutput ="false" requestLimit ="20" traceMode ="SortByTime " />     
    </system.web>
</configuration>

The page-level settings take precedence over settings in Web.config, so if enabled="false" is set in Web.config but trace="true" is set on the page, tracing occurs.

Viewing Trace Data

Tracing can be viewed for multiple page requests at the application level by requesting a special page called trace.axd. When ASP.NET detects an HTTP request for trace.axd, that request is handled by the TraceHandler rather than by a page.

Create a website and a page, and in the Page_Load event, call Trace.Write(). Enable tracing in Web.config as shown below.

<system.web>
      <compilation debug="false" />
      <authentication mode="Windows" />
    <trace enabled ="true" pageOutput ="true"  />     
    </system.web>
 
protected void Page_Load(object sender, EventArgs e)
    {
      System.Diagnostics.Trace.Write("This is Page_Load method!");
 
    }

When you run the page, you can see a great deal of trace information in the browser because we have set PageOutput=true as shown below.
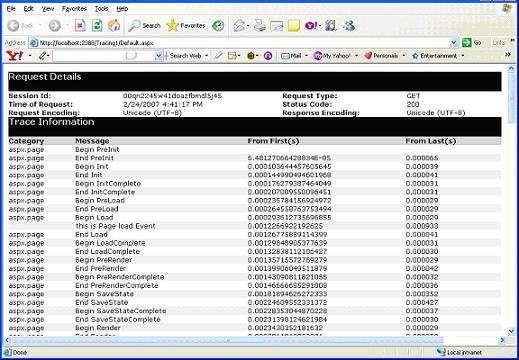

Trace Information

The message from Trace.write appears after Begin Load and before End Load. Eleven different sections in Trace provide a great deal of information.

Request Details: This section includes the ASP.NET Session ID, the character encoding of the request and response, and the HTTP conversation's returned status code.

TraceInformation: This section includes all the Trace.write methods called during the lifetime of the HTTP request and a great deal of information about timing. The timing information located here is valuable when profiling and searching for methods in your application that take too long to execute.
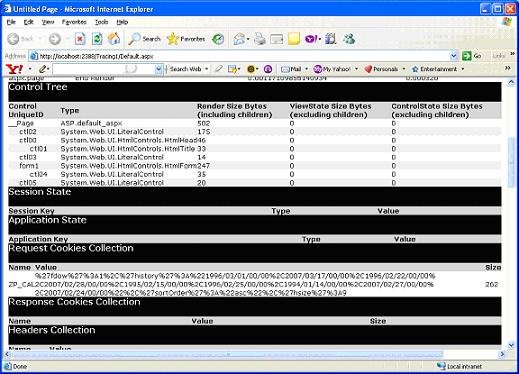

Trace Information

Control Tree: Control tree presents an HTML representation of the ASP.NET Control Tree. Shows each control's ID, run time type, the number of bytes it took to be rendered, and the bytes it requires in View State and Control State.

Session State: Lists all the keys for a particular user's session, their types and their values.

Application State: Lists all the keys in the current application's Application object and their type and values.

Request Cookies: Lists all the cookies passed in during the page is requested.

Response Cookies: Lists all the cookies that were passed back during the page's response.

Headers Collection: Shows all the headers that might be passed in during the request from the browser, including Accept-Encoding, indicating whether the browser supports the compressed HTTP responses and Accept languages.

Form Collection: Displays a complete dump of the Form Collection and all its keys and values.

QueryString Collection: Displays a dump of the Querystring collection and all its contained keys and values.

Server Variables: A complete dump of name-value pairs of everything that the web server knows about the application.

Trace.axd: Page output of tracing shows only the data collected for the current page request. However, if you want to collect detailed information for all the requests then we need to use Trace.axd. We can invoke Trace.axd tool for the application using the following URL http://localhost/application-name/trace.axd. Simply replace page name in URL with Trace.axd. That is, in our case. We should use following URL (Address bar) for our application as shown below.
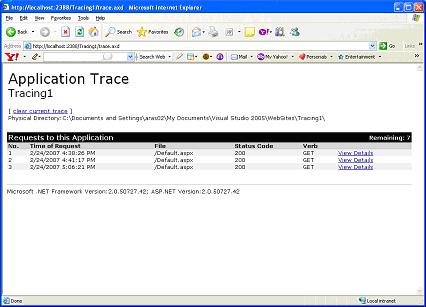

Application Trace

Trace.axd displays all the tracing information for all requests up to a present limit. Above figure shows that three requests have been made to this application and the right side of the header indicates "Remaining:7" That means that there is seven more requests remaining before tracing stops for this application. After that final request, tracing data is not saved until an application recycle or until you click "Clear Current Trace" from the Trace.axd page. The request limit can be raised in Web.config by setting requestLimit to a higher value as shown below

<trace enabled ="true" requestLimit ="20" pageOutput ="true"/>

Trace forwarding

ASP.NET 2.0 introduced new attribute to Web.config <trace> element that allows you to route messages emitted by ASP.NET tracing to System.Diagnostics.Trace:writeToDiagnosticsTrace.

<trace enabled ="true" requestLimit ="20" writeToDiagnosticsTrace ="true " pageOutput ="true"/>

When you set writeToDiagnosticsTrace to true, all calls to System.Web.UI.Page.Trace.Write(the ASP.NET TraceContent) also go to System.Diagnostics.Trace.Write, enabling you to use all the standard TraceListeners. The simple writeToDiagnosticsTrace setting connects the ASP.NET tracing functionality with the rest of the base class library.

New Trace Listeners in ASP.NET 2.0

The new ASP.NET 2.0 WebPageTraceListener derives from System.Diagnostics.TraceListener and automatically forwards tracing information from any component calls to System.Diagnostics.Trace.Write. This enables you to write your components using the most generic trace provider and to see its tracing output in the context of your ASP.NET application.

The WebPageTraceListener is added to the web.config as shown below.

<system.diagnostics>
    <trace autoflush ="false" indentsize ="4">
    <listeners>
      <add name="webListeners"
       type="System.Web.WebPageTraceListener, System.Web" />
     </listeners>
    </trace>

  </system.diagnostics>

XmlWriterTraceListener

XmlWriterTraceListener derives from TextWriterTraceListener and writes out a strongly typed XML file. The XML created is not well formed. Specifically, it doesn't have root node. It's just collection of peer nodes.

DelimitedListTraceListener

DelimitedListTraceListener derives from TextWriterTraceListener. It writes out comma-separated values (CSV) files.

Hence, this article gives brief introduction to new trace features available in ASP.NET 2.0

Happy learning!!!!!!!

Ravi S replied to aman on 30-Aug-11 02:58 AM
Hi

What is Tracing?


ASP.NET introduces new functionality that allows you to write debug statements, directly in your code, without having to remove them from your application when it is deployed to production http://www.kyapoocha.com/aspnet-interview-questions/what-is-tracing-in-aspnet/. Called tracing, this feature allows you to write variables or structures in a page, assert whether a condition is met, or simply trace through the execution path of your page or http://www.kyapoocha.com/aspnet-interview-questions/what-is-tracing-in-aspnet/

http://www.kyapoocha.com/aspnet-interview-questions/what-is-tracing-in-aspnet/

http://www.kyapoocha.com/aspnet-interview-questions/what-is-tracing-in-aspnet/.web element.


In the trace element, set the enabled attribute to true.


If you want trace information to appear at the end of the page that it is associated with, set the trace element's pageOutput attribute to true. If you want tracing information to be displayed only in the trace viewer, set the pageOutput attribute to false.


.

  refer

http://www.dotnetheaven.com/UploadFile/prathore/Tracing10122007030241AM/Tracing.aspx

http://aspnet.4guysfromrolla.com/default.aspx

Reena Jain replied to aman on 30-Aug-11 02:59 AM
Hi,

ASP.NET introduces new functionality that allows you to view diagnostic information about a single request for an ASP.NET page simply by enabling it for your page or application. Called tracing, this feature also allows you to write debug statements directly in your code without having to remove them from your application when it is deployed to production servers. You can write variables or structures in a page, assert whether a condition is met, or simply trace through the execution path of your page or application.

In order for these messages and other tracing information to be gathered and displayed, you must enable tracing for the page or application. When you enable tracing, two things occur:

  • ASP.NET appends a series of diagnostic information tables immediately following the page's output. The information is also sent to a trace viewer application (if you have enabled tracing for the application).
  • ASP.NET displays your custom diagnostic messages in the Trace Information table of the appended performance data.

Diagnostic information and tracing messages that you specify are appended to the output of the page that is sent to the requesting browser. Optionally, you can view this information from a separate trace viewer (Trace.axd) that displays trace information for every page in a given application. This information can help you to clarify errors or undesired results as ASP.NET processes a page request.

Trace statements are processed and displayed only when tracing is enabled. You can control whether tracing is displayed to a page, to the trace viewer, or both.

When tracing is enabled you automagically get a plethora of information on the ASP.NET Web page. Information like:

  •     Request Details - Session Id; Request time, type, and encoding; status code, etc.
  •     Trace Information - Page-level ASP.NET messages that you specify via Trace.Write and Trace.Warn.
  •     Control Tree - A listing of the Web controls on the ASP.NET Web page, and how they relate to one another.
  •     Cookies Collection - A listing of all of the cookies.
  •     Headers Collection - A listing of all of the HTTP headers.
  •     Server Variables - A listing of all of the server variables.

Anoop S replied to aman on 30-Aug-11 03:01 AM
ASP.NET tracing enables you to view diagnostic information about a single request for an ASP.NET page. ASP.NET tracing enables you to follow a page's execution path, display diagnostic information at run time, and debug your application. ASP.NET tracing can be integrated with system-level tracing to provide multiple levels of tracing output in distributed and multi-tier applications.

Tracing appends diagnostic information and custom tracing messages to the output of the page and sends this information to the requesting browser. Optionally, you can view this information from a separate trace viewer (Trace.axd) that displays trace information for every page in an ASP.NET Web application. Tracing information can help you investigate errors or unwanted results while ASP.NET processes a page request.

You can configure individual pages to display trace information. Alternatively, you can configure the application's Web.config file so that all pages display trace information unless the page explicitly disables tracing. Setting application-level tracing is useful because you do not have to change individual pages to enable and disable it.

Trace statements are processed and displayed only when tracing is enabled. You can control whether tracing is displayed to a page, to the trace viewer, or both. For information about how to enable tracing for a page, see http://msdn.microsoft.com/en-us/library/94c55d08.aspx. For information about how to enable tracing for an application, see http://msdn.microsoft.com/en-us/library/0x5wc973.aspx.


refer this for more details
http://msdn.microsoft.com/en-us/library/bb386420.aspx
dipa ahuja replied to aman on 30-Aug-11 03:29 AM
What is tracing?

ASP.NET enables you to view diagnostic information about a request for an ASP.NET page. Tracing also enables you to write debug statements directly in your code without having to remove them from your application when it is deployed to production servers. You can write variables or structures in a page, assert whether a condition is met, or simply trace through the execution path of your page or application. You can view tracing information appended to the end of a page, or in a separate trace viewer, or both.

To achieve tracing you have to add the trace attribute in the page directive:

<%@ Page Language="C#" AutoEventWireup="true" Trace="true" CodeFile="default.aspx.cs" Inherits="default" %>
Or in web.config:
<trace pageOutput="true" requestLimit="10" enabled="true" localOnly="true"
  traceMode="SortByTime" mostRecent="true"/>
Mark Joseph replied to aman on 30-Aug-11 04:02 AM
To say that debugging support was lacking in classic ASP is a bit of an understatement. One of the most common debugging "techniques" for classic ASP developers was to simply place Response.Write statements in various code portions in order to see certain variable values or to ensure that a particular piece of code was being reached. One of the most common / useful places to put such a debugging Response.Write is right before executing a dynamic SQL statement.

ASP.NET (finally) introduces modern programming practices into Web development, something that's sorely been sorely lacking. With ASP.NET you can, quite easily, debug your ASP.NET Web pages using Visual Studio.NET's debugger. This means that you can step into your code, set breakpoints, have a watch window to observe the values or your variables, etc. This article, however, is not going to delve into the specifics of using VS.NET's debugger on an ASP.NET Web page (perhaps a future article will...), but, rather, in this article we'll look at how to use a simpler version of debugging in ASP.NET, akin to classic ASP's Response.Write method.

Problems with Classic ASP's Response.Write Debugging Method
While the Response.Write method for printing debugging information in an ASP.NET Web page is simple, quick, and useful, it has several downsides as well. For example, if you have a live site, but need to perform some quick debugging on a particular ASP page, your users may see debugging information in the form of Response.Write statements (which makes the site look very unprofessional.) Furthermore, while developing your site, you may place several Response.Write statements throughout your application. Once you're ready to ship your application, however, you must go through each page removing any diagnostic Response.Write statements.

Using ASP.NET's Tracing Features
ASP.NET provides developers with a much more refined process for outputting page-level information. With ASP.NET, rather than using Response.Write, use Trace.Write or Trace.Warn. These two methods both expect two String parameters and can be called like so:

'Display an informational message
Trace.Write(category, message)

'Display a warning (shown in RED)
Trace.Warn(category, message)

These two statements can be littered throughout your ASP.NET Web page as you see fit. Recall that one of the weaknesses of classic ASP's Response.Write statements is that the statements always appear, and, in order to remove them from the output, you must go through each page and remove the superfluous statements. With ASP.NET's Trace.Write and Trace.Warn statements, however, these statements only appear when tracing is enabled. There are two ways to enable tracing - on a page-level and on a Web application-level.

We'll examine how to work with Web application-level tracing in a bit, but let's first look at enabling page-level tracing. All it takes to turn on (or off) page-level tracing is the setting of the Trace attribute in the @Page directive:

<% @Page Trace="[True|False]" %>

When tracing is enabled you automagically get a plethora of information on the ASP.NET Web page. Information like:

    Request Details - Session Id; Request time, type, and encoding; status code, etc.
    Trace Information - Page-level ASP.NET messages that you specify via Trace.Write and Trace.Warn.
    Control Tree - A listing of the Web controls on the ASP.NET Web page, and how they relate to one another.
    Cookies Collection - A listing of all of the cookies.
    Headers Collection - A listing of all of the HTTP headers.
    Server Variables - A listing of all of the server variables.

You can see a sample of the tracing output, just scroll down to the bottom of the page. Kudos to the ASP.NET team for providing such useful debugging information all in one spot by only requiring one simply page-level directive.

Since this plethora of useful information only appears if tracing is enabled, you can place Trace.Write and Trace.Warn statements throughout the page and not need to worry about removing them when shipping your application - rather, you just need to visit each page and set tracing to false:

<% @Page Trace="False" %>

In the live demo, notice how I used the tracing. I used Trace.Write statements at the beginning and end of each of my page-level subroutines, just so I know when I'm entering and leaving the sub. I also used a Trace.Write to output the value of my dynamic SQL string. Finally, I used a Trace.Warn to warn myself (or other developers/debuggers) that a hard-coded SQL statement is used as opposed to the preferred stored procedure route.

Turning on Web-Application Wide Tracing
By turning tracing on and off at a page-level, we still have some of the inherent disadvantages found in using the Response.Write approach. Namely, when you want to disable tracing, you must go through each page and set Trace to False. Also, if you wish to turn on tracing for a live Web site, every visitor will see the tracing output at the bottom of the page.

Fortunately ASP.NET eases alleviates these worries by providing developers the opportunity to turn on (and off) tracing for an entire Web application. To do this, use the trace setting in Web.config. (Web.config is an XML-based configuration file that is located in the root directory of your Web application. For more information on Web.config check out this article.) The trace setting accepts the following parameters:

<trace enabled="[true|false]"
     localOnly="[true|false]"
     pageOutput="[true|false]"
     requestLimit="[number]"
     traceMode="[SortByTime|SortByCategory]" />

To enable tracing output on your ASP.NET Web pages for the entire Web application, simply set enabled to true and pageOutput to true. If you are working on a live site, you can set localOnly to true, meaning that only those hitting the site through http://localhost will see the tracing information.

The settings in the Web.config file simply specify the default behavior; that is, what is to happen if no page-level directive for tracing is specified. Of course, you can override these settings on a page-level by explicitly setting the Trace page-directive to True or False.

Something to Try...
Wanna see something neat? Set the Web.config's trace to enabled as true and requestLimit to some value greater than zero. Now, visit some ASP.NET Web pages in your Web application. Now, point your browser to http://localhost/trace.axd (or whatever the directory is for your Web application). Neat, eh? :-)

Conclusion
In this article we examined ASP.NET's tracing features, a simple debugging technique that is superior to classic ASP's Response.Write method. Tracing can be enabled at both the page and Web application-level. For more information on ASP.NET, be sure to visit the ASP.NET Article Index.

==
Thanks,
http://www.alliancetek.com/